When you’re trying to prove the value of your talent team, measuring hiring effectiveness suddenly feels like the only thing that matters. It’s not just about filling seats; it’s about linking people decisions to the bottom line. In this guide I’ll walk you through the metrics that actually matter, the benchmarks that keep you honest, and the tricks that turn raw data into hiring success.
Why Hiring Effectiveness Matters Today
Companies lose up to 30% of new hires within the first year – that’s a huge drain on cash and culture. If you can spot the weak spots early, you can shave weeks off your time to fill and cut costs dramatically. Plus, investors are watching your talent ROI like hawks. So, are you ready to stop guessing and start measuring?
What is Hiring Effectiveness?
Definition and Scope
Hiring effectiveness is the degree to which your recruitment process delivers the right talent, at the right time, for the right price. It stretches beyond speed; it includes performance, retention, and even the diversity impact of each hire.
Difference from Related Terms
Don’t confuse hiring effectiveness with quality of hire alone. Quality of hire zeroes in on post‑hire performance, while recruitment efficiency focuses on speed and cost. Hiring effectiveness blends all three – speed, cost, and quality – into a single, business‑focused view.
Also Read: From Gut Feel to Data-Driven Hiring Decisions
Key Metrics to Measure Hiring Effectiveness
Time to Fill vs Time to Hire
Time to fill tracks the days from when a requisition opens to when an offer is accepted. Time to hire (or time to fill) zeroes in on the period from candidate application to acceptance. Time to hire vs time to fill reveals bottlenecks in sourcing versus interviewing.
- Formula: Time to Fill = Offer Acceptance Date – Requisition Open Date
- Formula: Time to Hire = Offer Acceptance Date – First Candidate Application Date
Cost per Hire
This metric tells you exactly how much each new employee costs your organization. Include advertising spend, agency fees, recruiter time, and onboarding resources.
- Formula: Cost per Hire = (Total Recruiting Spend + Internal Labor Costs) ÷ Number of Hires
- Use a cost per hire calculation spreadsheet to keep the numbers transparent.
Quality of Hire
Quality of hire measures the performance and longevity of new employees. You can look at performance review scores, 12‑month retention, and manager satisfaction.
- Sample KPI: Average Performance Rating of New Hires after 12 months
- Sample KPI: New Hire Retention Rate (first year)
- This is essentially a quality of hire measurement exercise.
New Hire Turnover Rate
First‑year turnover is a red flag. A rate above 20% often signals mismatched expectations or poor cultural fit.
Hiring Manager Satisfaction Score
Survey hiring managers after each hire. Ask them to rate the relevance of the candidate pool, the speed of the process, and the overall experience on a 1‑5 scale.
Diversity and Inclusion Impact
Track the representation of under‑represented groups at each stage. Diversity metrics aren’t just a box; they correlate with innovation and market reach.
Hiring Benchmarks You Should Know
Industry Averages for Each Key Metric
| Metric | Industry Avg (2024) | Ideal Target |
|---|---|---|
| Time to Fill | 45 days | 30‑35 days |
| Time to Hire | 31 days | 20‑25 days |
| Cost per Hire | $4,800 | Under $3,500 |
| Quality of Hire Score | 78/100 | 85+/100 |
| First‑Year Turnover | 22% | Under 15% |
| Diversity Ratio (U\R groups) | 28% | 30%+ |
Adjusting Benchmarks for Organization Size and Role Type
Start‑ups often see faster cycles but higher turnover. Large enterprises enjoy lower turnover but longer fills. Adjust your targets by +/- 10% based on headcount and seniority.
Common Challenges in Measuring Hiring Effectiveness
Data Silos and Inconsistent Tracking: Recruiting data lives in the ATS, performance data in the HRIS, and financials in the ERP. When they don’t talk, your metrics are guesswork.
Attribution of Performance to Hiring Decisions: It’s tempting to blame a dip in sales on bad hires, but you need a clear link between employee performance and the recruiting source.
Balancing Speed with Quality: Push for a 20‑day fill and you might sacrifice cultural fit. The sweet spot lies where speed meets a solid quality of hire score.
Best Practices to Improve Hiring Effectiveness
Implementing a Unified Analytics Framework: Map every data point from requisition to performance into a single dashboard. Use a data‑warehouse or a specialized HR analytics platform.
Regular KPI Reviews and Stakeholder Alignment: Meet monthly with recruiters, hiring managers, and finance. Review the talent acquisition KPIs and adjust plans on the fly.
Using Predictive Analytics for Hiring Outcomes: Simple regression models can flag candidates likely to stay beyond 12 months. You don’t need fancy AI; a well‑tuned spreadsheet does the trick for most firms.
Hiring ROI: Linking Metrics to Business Outcomes
ROI isn’t a mystery formula. Take the additional revenue generated by high‑performing hires, subtract the cost per hire, and divide by the total recruiting spend.
- Example: A sales rep brings $150k in incremental revenue. Cost per hire is $5k. ROI = ($150k – $5k) ÷ $5k = 29x.
This simple hiring success metrics view keeps the conversation grounded in dollars.
Impact of Diversity on Hiring Effectiveness
Teams with at least 30% diverse members outperform peers by 12% on profitability. Track diversity ratios alongside quality of hire to see the correlation.
- KPI: Diversity Hiring Ratio = Diverse Hires ÷ Total Hires
- KPI: Diversity Performance Index = Avg. Performance of Diverse Hires ÷ Avg. Performance of All Hires
Future Trends: AI‑Driven Predictive Hiring Models
Next‑gen platforms are moving from descriptive dashboards to prescriptive recommendations. They score candidates based on historical success patterns, updating the model each quarter.
While the hype is real, start small. Pilot a model on one business unit, compare predicted turnover against actual, and iterate.
Tools to Measure Hiring Effectiveness
ATS Built‑in Dashboards: Most modern ATSs (Greenhouse, Lever) surface time to fill, source‑of‑hire, and basic cost data. They’re great for quick checks but often lack deep performance integration.
Dedicated HR Analytics Platforms: Solutions like Visier, Crunchr, or PeopleFluent pull data from multiple systems and let you build custom recruitment effectiveness metrics reports.
Survey Tools for Manager and Candidate Feedback: Tools such as Culture Amp or Qualtrics capture hiring manager satisfaction and candidate experience scores, feeding them into your effectiveness dashboard.
Step‑by‑Step Implementation Framework
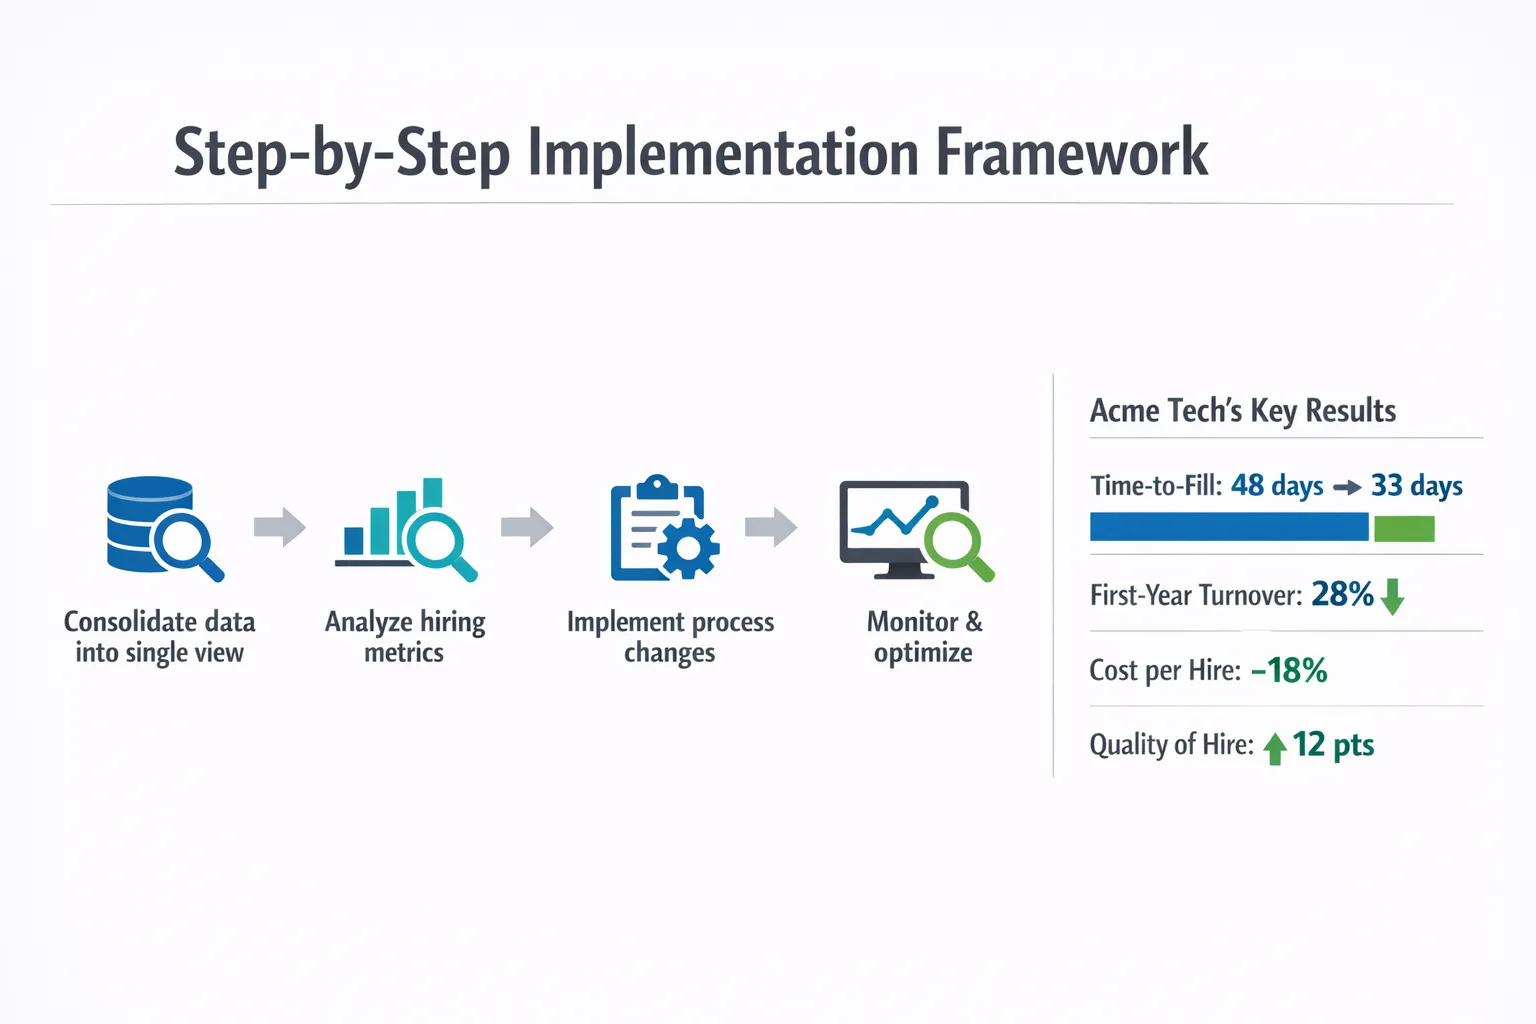
- Define the core metrics you’ll track (time to hire, cost per hire, quality of hire, diversity ratio).
- Map data sources – ATS for speed, Finance for cost, HRIS for performance.
- Build a central dashboard (Excel, Power BI, or a dedicated platform).
- Set benchmark targets based on industry averages and your own historic data.
- Roll out monthly KPI reviews with all stakeholders.
- Apply predictive models to the top‑performing roles and measure impact.
Also Read: How AI Candidate Matching Improves Hiring Accuracy
Case Study Snapshot: From Chaos to 25% ROI
Acme Tech, a mid‑size SaaS firm, struggled with a 48‑day average time to fill and a 28% first‑year turnover. By consolidating data into a single analytics view, they cut time to fill to 33 days, reduced cost per hire by 18%, and lifted quality of hire scores by 12 points. The resulting hiring ROI climbed to 22x within six months.
Wrapping Up
Measuring hiring effectiveness isn’t a one‑off project; it’s a continuous conversation between talent, finance, and the business. Start with the core metrics, compare against realistic benchmarks, and use the data to drive smarter decisions. When you tie each hire to revenue and diversity outcomes, you turn recruitment from a cost center into a strategic engine.
Ready to take the next step? Pull your ATS data, run the simple formulas above, and schedule a KPI sync next week. The sooner you start, the quicker you’ll see the impact on your bottom line.
Frequently Asked Questions
How can I link hiring metrics to overall business performance?
Map each hiring metric to a specific business outcome, such as revenue per employee or turnover cost savings. For example, correlate quality‑of‑hire scores with sales growth or customer satisfaction. Use dashboards that display both HR and financial KPIs side by side to illustrate impact.
What benchmarks are typical for time‑to‑fill in the technology sector?
In tech, the average time‑to‑fill ranges from 45 to 60 days, depending on role seniority. For high‑demand software engineering positions it can be 30–45 days, while senior architect roles often exceed 70 days. Compare your figures against industry surveys like LinkedIn Talent Trends for more precise targets.
Which tools can automate reporting on hiring effectiveness?
Applicant tracking systems (ATS) such as Greenhouse, Lever, or iCIMS provide built‑in analytics for time‑to‑fill, cost‑per‑hire, and source effectiveness. Business intelligence platforms like Tableau or Power BI can pull data from the ATS and HRIS to create custom dashboards. Some vendors also offer AI‑driven predictive models to forecast hiring outcomes.
How frequently should I review my hiring metrics?
Review core metrics (time‑to‑fill, cost‑per‑hire) monthly to spot short‑term trends, and conduct a deeper quarterly analysis that includes quality‑of‑hire and retention data. Align metric reviews with your talent acquisition planning cycle, typically every fiscal quarter, to adjust sourcing strategies in time.
What is a reasonable cost‑per‑hire target for a mid‑size company?
For firms with 200–500 employees, a typical cost‑per‑hire falls between $4,000 and $6,000, covering advertising, agency fees, and recruiting staff time. Adjust the target based on role complexity; technical or executive hires often exceed $10,000, while entry‑level positions may be under $2,500.